


signal strength 1 of 5
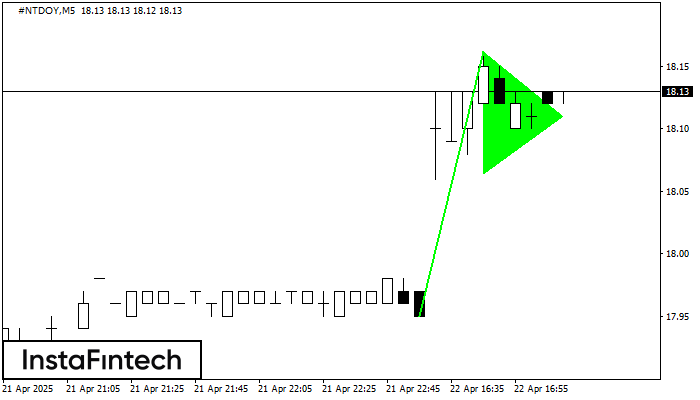
The Bullish pennant signal – Trading instrument #NTDOY M5, continuation pattern. Forecast: it is possible to set up a buy position above the pattern’s high of 18.16, with the prospect of the next move being a projection of the flagpole height.
The M5 and M15 time frames may have more false entry points.
- All
- Double Top
- Flag
- Head and Shoulders
- Pennant
- Rectangle
- Triangle
- Triple top
- All
- #AAPL
- #AMZN
- #Bitcoin
- #EBAY
- #FB
- #GOOG
- #INTC
- #KO
- #MA
- #MCD
- #MSFT
- #NTDOY
- #PEP
- #TSLA
- #TWTR
- AUDCAD
- AUDCHF
- AUDJPY
- AUDUSD
- EURCAD
- EURCHF
- EURGBP
- EURJPY
- EURNZD
- EURRUB
- EURUSD
- GBPAUD
- GBPCHF
- GBPJPY
- GBPUSD
- GOLD
- NZDCAD
- NZDCHF
- NZDJPY
- NZDUSD
- SILVER
- USDCAD
- USDCHF
- USDJPY
- USDRUB
- All
- M5
- M15
- M30
- H1
- D1
- All
- Buy
- Sale
- All
- 1
- 2
- 3
- 4
- 5
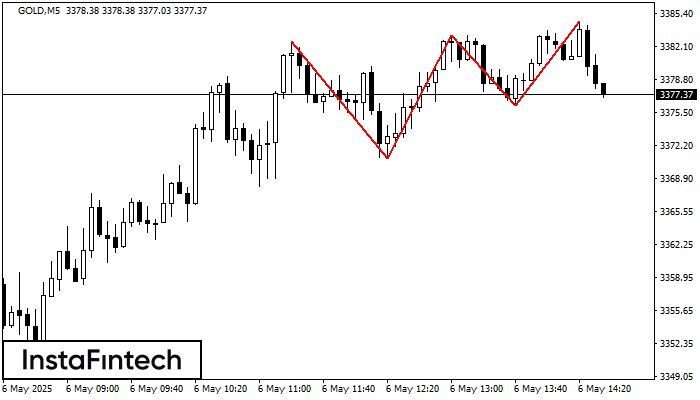
รูปแบบ รูปแบบกราฟจุดสามยอด (Triple Top) ได้สร้างขึ้นมาในชาร์ตของ GOLD M5 ที่เป็นตราสารการซื้อขาย มันเป็นกราฟรูปแบบกราฟรูปแบบย้อนกลับ ที่มีคุณลักษณะดังต่อไปนี้ : ระดับของแนวต้าน -193, ระดับของแนวรับ -528
ขอบเตระยะเวลาใน M5 และ M15 อาจจะมีตำแหน่งการเข้าใช้งานที่ผิดพลาดมากยิ่งขึ้น
Open chart in a new windowwas formed on 06.05 at 13:10:34 (UTC+0)
signal strength 1 of 5
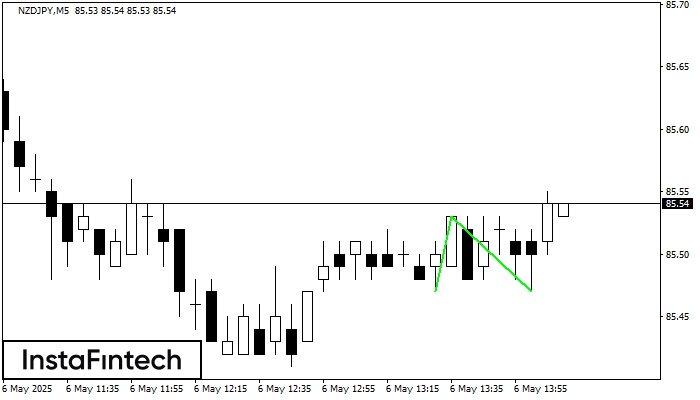
รูปแบบ รูปแบบกราฟจุดสองยอดขาลง (Double Bottom) ถูกสร้างขึ้นมาใน NZDJPY M5 การก่อตัวเช่นนี้แสดงถึงการย้อนตัวของแนวโน้มจากด้านล่าง ขึ้นมายังด้านบน สัญญาณแสดงให้เห็นถึง การเทรดแบบการซื้อที่ควรเปิด หลังจากที่มีการเคลื่อนตัวทะลุผ่านขอบเขตด้านบนของรูปแบบ 85.53 การเคลื่อนไหวต่อจากนั้นจะอยู่ในความกว้างของรูปแบบปัจจุบัน
ขอบเตระยะเวลาใน M5 และ M15 อาจจะมีตำแหน่งการเข้าใช้งานที่ผิดพลาดมากยิ่งขึ้น
Open chart in a new windowwas formed on 06.05 at 12:10:30 (UTC+0)
signal strength 1 of 5
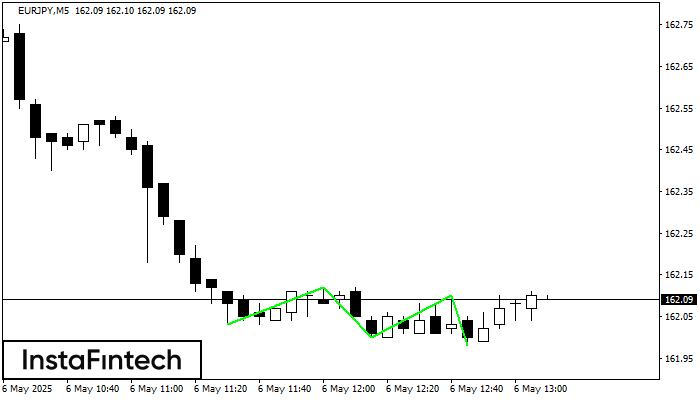
รูปแบบ รูปแบบกราฟจุดสามยอดขาลง (Triple Bottom) ได้สร้างขึ้นมาในชาร์ตของ EURJPY M5 ลักษณะของกราฟรูปแบบนี้: เส้นด้านล่างของกราฟรูปแบบนี้มีพิกัดอยู่ที่ 162.12 พร้อมกับลิมิตด้านบน 162.12/162.10,ระยะของความกว้างคือ 9 จุด การก่อตัวของกราฟรูปแบบ
ขอบเตระยะเวลาใน M5 และ M15 อาจจะมีตำแหน่งการเข้าใช้งานที่ผิดพลาดมากยิ่งขึ้น
Open chart in a new window


