


сила сигнала 1 из 5
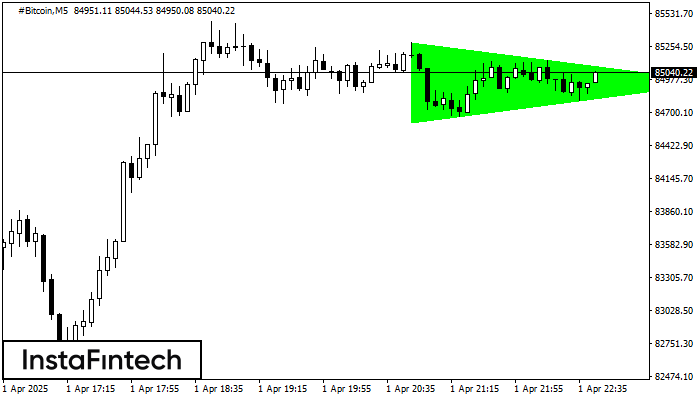
По #Bitcoin на M5 сформировалась фигура «Бычий симметричный треугольник», которая сигнализирует нам о продолжении тенденции. Характеристика: Верхняя граница фигуры имеет координаты 85289.02/84955.46; Нижняя граница 84612.93/84955.46; Проекция ширины фигуры 67609 пунктов. Формирование фигуры «Бычий симметричный треугольник» на восходящем тренде свидетельствует о продолжении текущего движения, где, в случае пробоя значения 84955.46, возможно движение к 84955.61.
Таймфреймы М5 и М15 могут иметь больше ложных точек входа.
- Все
- Вымпел
- Голова и плечи
- Двойная вершина
- Прямоугольник
- Треугольник
- Тройная вершина
- Флаг
- Все
- #AAPL
- #AMZN
- #Bitcoin
- #EBAY
- #FB
- #GOOG
- #INTC
- #KO
- #MA
- #MCD
- #MSFT
- #NTDOY
- #PEP
- #TSLA
- #TWTR
- AUDCAD
- AUDCHF
- AUDJPY
- AUDUSD
- EURCAD
- EURCHF
- EURGBP
- EURJPY
- EURNZD
- EURRUB
- EURUSD
- GBPAUD
- GBPCHF
- GBPJPY
- GBPUSD
- GOLD
- NZDCAD
- NZDCHF
- NZDJPY
- NZDUSD
- SILVER
- USDCAD
- USDCHF
- USDJPY
- USDRUB
- Все
- M5
- M15
- M30
- H1
- D1
- Все
- Покупка
- Продажа
- Все
- 1
- 2
- 3
- 4
- 5
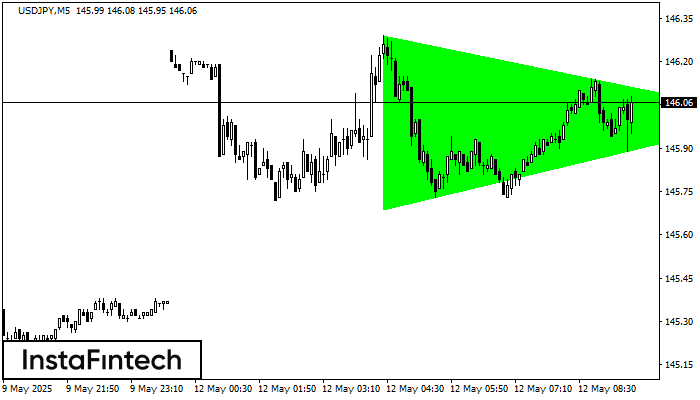
According to the chart of M5, USDJPY formed the Bullish Symmetrical Triangle pattern. The lower border of the pattern touches the coordinates 145.69/146.01 whereas the upper border goes across 146.29/146.01
The M5 and M15 time frames may have more false entry points.
Open chart in a new window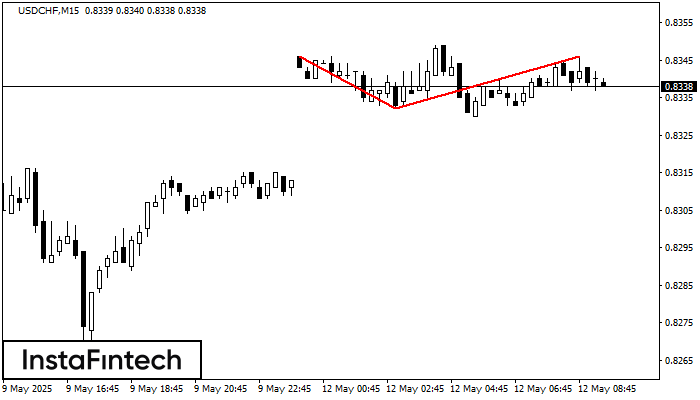
The Double Top reversal pattern has been formed on USDCHF M15. Characteristics: the upper boundary 0.8346; the lower boundary 0.8332; the width of the pattern is 14 points. Sell trades
The M5 and M15 time frames may have more false entry points.
Open chart in a new window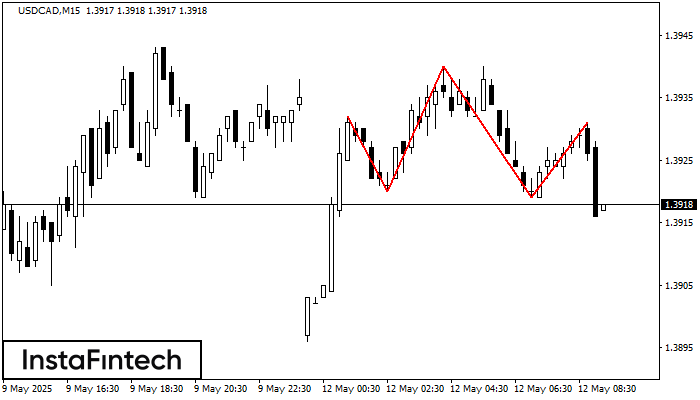
According to the chart of M15, USDCAD formed the Head and Shoulders pattern. The Head’s top is set at 1.3940 while the median line of the Neck is found
The M5 and M15 time frames may have more false entry points.
Open chart in a new window


