

сила сигнала 1 из 5
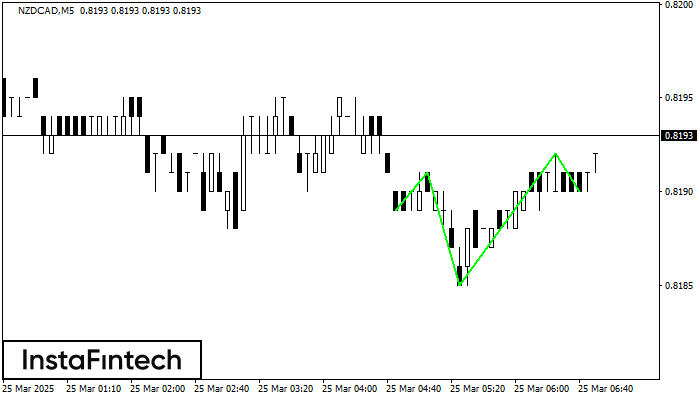
Формирование разворотной графической фигуры «Перевернутая голова и плечи» по торговому инструменту NZDCAD на M5. Прогноз: в случае пробоя уровня шеи 0.8191/0.8192 вероятно движение в направлении координат 0.8207.
Таймфреймы М5 и М15 могут иметь больше ложных точек входа.
Shuningdek ko'ring
- Все
- Вымпел
- Голова и плечи
- Двойная вершина
- Прямоугольник
- Треугольник
- Тройная вершина
- Флаг
- Все
- #AAPL
- #AMZN
- #Bitcoin
- #EBAY
- #FB
- #GOOG
- #INTC
- #KO
- #MA
- #MCD
- #MSFT
- #NTDOY
- #PEP
- #TSLA
- #TWTR
- AUDCAD
- AUDCHF
- AUDJPY
- AUDUSD
- EURCAD
- EURCHF
- EURGBP
- EURJPY
- EURNZD
- EURRUB
- EURUSD
- GBPAUD
- GBPCHF
- GBPJPY
- GBPUSD
- GOLD
- NZDCAD
- NZDCHF
- NZDJPY
- NZDUSD
- SILVER
- USDCAD
- USDCHF
- USDJPY
- USDRUB
- Все
- M5
- M15
- M30
- H1
- D1
- Все
- Покупка
- Продажа
- Все
- 1
- 2
- 3
- 4
- 5
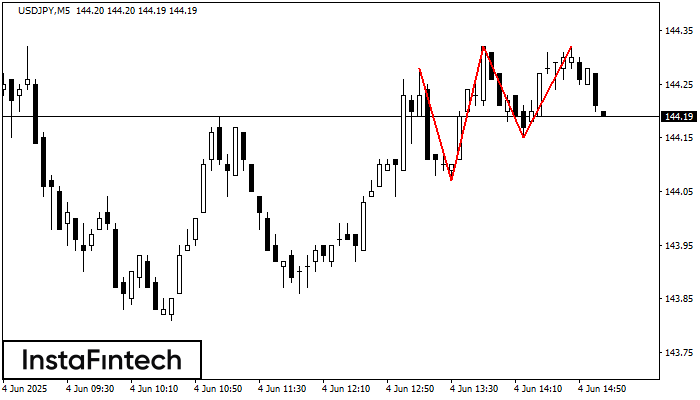
On the chart of the USDJPY M5 trading instrument, the Triple Top pattern that signals a trend change has formed. It is possible that after formation of the third peak
The M5 and M15 time frames may have more false entry points.
Открыть график инструмента в новом окне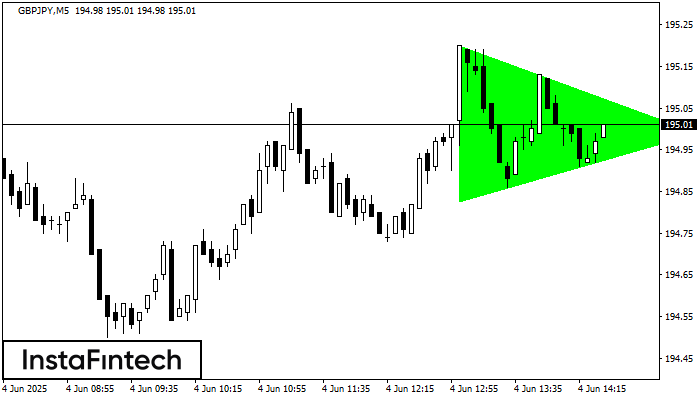
According to the chart of M5, GBPJPY formed the Bullish Symmetrical Triangle pattern, which signals the trend will continue. Description. The upper border of the pattern touches the coordinates 195.20/194.99
The M5 and M15 time frames may have more false entry points.
Открыть график инструмента в новом окне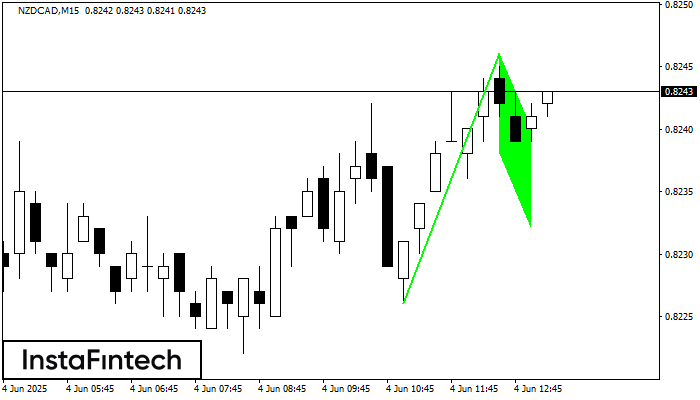
The Bullish Flag pattern has been formed on NZDCAD at M15. The lower boundary of the pattern is located at 0.8238/0.8232, while the higher boundary lies at 0.8246/0.8240. The projection
The M5 and M15 time frames may have more false entry points.
Открыть график инструмента в новом окне


