

сила сигнала 3 из 5

По GBPUSD на M30 сформировалась фигура «Бычий симметричный треугольник». Нижняя граница фигуры имеет координаты 1.2876/1.2915, при этом верхняя граница 1.2971/1.2915. Формирование фигуры «Бычий симметричный треугольник» наиболее вероятным образом свидетельствует о продолжении восходящего тренда. Это означает, что курс GBPUSD, в случае срабатывания фигуры, пробьет верхнюю границу и направится к значению 1.2945.
Shuningdek ko'ring
- Все
- Вымпел
- Голова и плечи
- Двойная вершина
- Прямоугольник
- Треугольник
- Тройная вершина
- Флаг
- Все
- #AAPL
- #AMZN
- #Bitcoin
- #EBAY
- #FB
- #GOOG
- #INTC
- #KO
- #MA
- #MCD
- #MSFT
- #NTDOY
- #PEP
- #TSLA
- #TWTR
- AUDCAD
- AUDCHF
- AUDJPY
- AUDUSD
- EURCAD
- EURCHF
- EURGBP
- EURJPY
- EURNZD
- EURRUB
- EURUSD
- GBPAUD
- GBPCHF
- GBPJPY
- GBPUSD
- GOLD
- NZDCAD
- NZDCHF
- NZDJPY
- NZDUSD
- SILVER
- USDCAD
- USDCHF
- USDJPY
- USDRUB
- Все
- M5
- M15
- M30
- H1
- D1
- Все
- Покупка
- Продажа
- Все
- 1
- 2
- 3
- 4
- 5
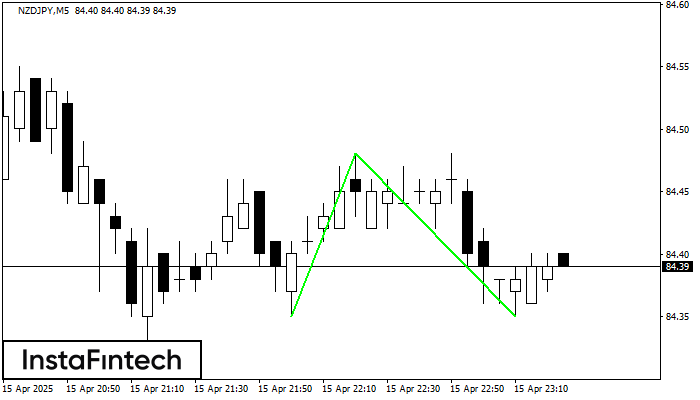
The Double Bottom pattern has been formed on NZDJPY M5. Characteristics: the support level 84.35; the resistance level 84.48; the width of the pattern 13 points. If the resistance level
The M5 and M15 time frames may have more false entry points.
Открыть график инструмента в новом окне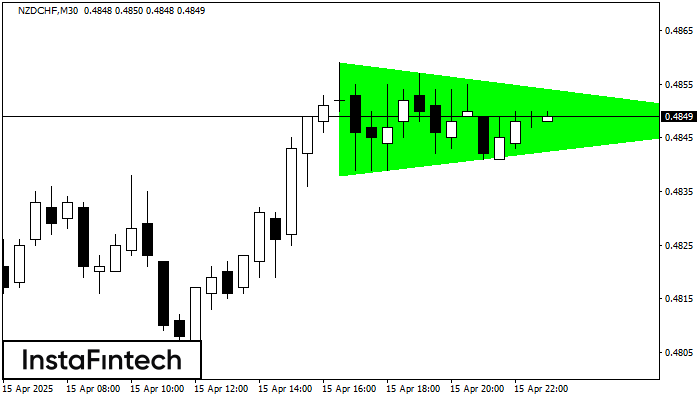
According to the chart of M30, NZDCHF formed the Bullish Symmetrical Triangle pattern. The lower border of the pattern touches the coordinates 0.4838/0.4848 whereas the upper border goes across 0.4859/0.4848
Открыть график инструмента в новом окне
According to the chart of M30, NZDCHF formed the Bullish Rectangle. This type of a pattern indicates a trend continuation. It consists of two levels: resistance 0.4859 and support 0.4839
Открыть график инструмента в новом окне


