

сила сигнала 1 из 5
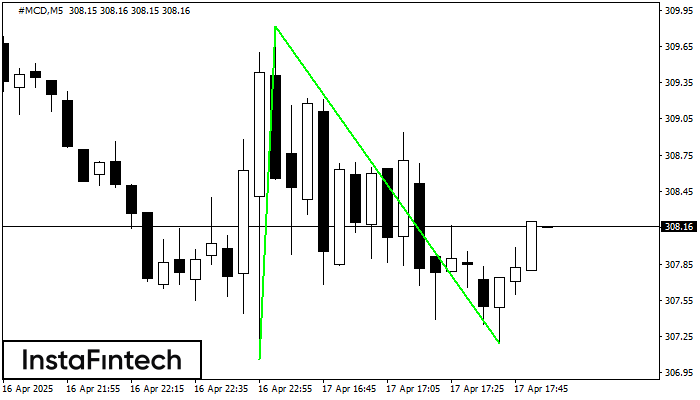
Сформирована фигура «Двойное дно» на графике #MCD M5. Характеристика: Уровень поддержки 307.06; Уровень сопротивления 309.81; Ширина фигуры 275 пунктов. В случае пробоя уровня сопротивления можно будет прогнозировать изменение тенденции, где первая точка фиксации прибыли находится на расстоянии 262 пунктов.
Таймфреймы М5 и М15 могут иметь больше ложных точек входа.
- Все
- Вымпел
- Голова и плечи
- Двойная вершина
- Прямоугольник
- Треугольник
- Тройная вершина
- Флаг
- Все
- #AAPL
- #AMZN
- #Bitcoin
- #EBAY
- #FB
- #GOOG
- #INTC
- #KO
- #MA
- #MCD
- #MSFT
- #NTDOY
- #PEP
- #TSLA
- #TWTR
- AUDCAD
- AUDCHF
- AUDJPY
- AUDUSD
- EURCAD
- EURCHF
- EURGBP
- EURJPY
- EURNZD
- EURRUB
- EURUSD
- GBPAUD
- GBPCHF
- GBPJPY
- GBPUSD
- GOLD
- NZDCAD
- NZDCHF
- NZDJPY
- NZDUSD
- SILVER
- USDCAD
- USDCHF
- USDJPY
- USDRUB
- Все
- M5
- M15
- M30
- H1
- D1
- Все
- Покупка
- Продажа
- Все
- 1
- 2
- 3
- 4
- 5
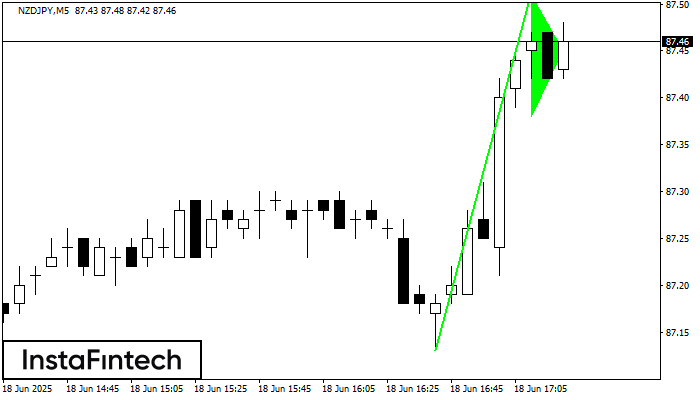
The Bullish pennant pattern is formed on the NZDJPY M5 chart. It is a type of the continuation pattern. Supposedly, in case the price is fixed above the pennant’s high
The M5 and M15 time frames may have more false entry points.
Открыть график инструмента в новом окне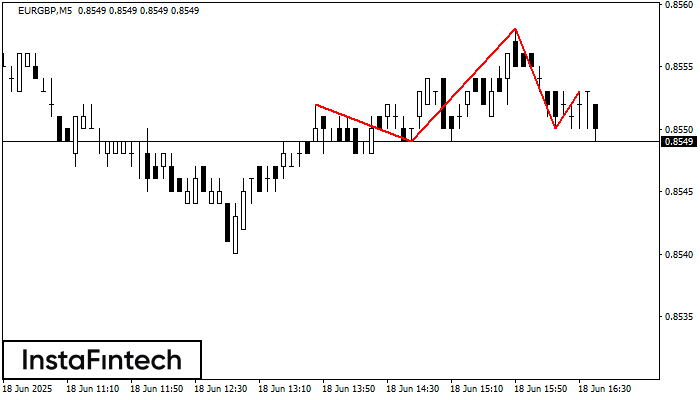
The technical pattern called Head and Shoulders has appeared on the chart of EURGBP M5. There are weighty reasons to suggest that the price will surpass the Neckline 0.8549/0.8550 after
The M5 and M15 time frames may have more false entry points.
Открыть график инструмента в новом окне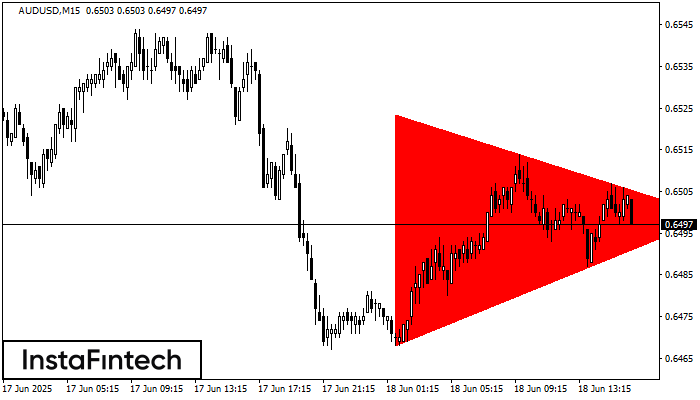
According to the chart of M15, AUDUSD formed the Bearish Symmetrical Triangle pattern. Description: The lower border is 0.6468/0.6499 and upper border is 0.6523/0.6499. The pattern width is measured
The M5 and M15 time frames may have more false entry points.
Открыть график инструмента в новом окне


