

signal strength 2 of 5
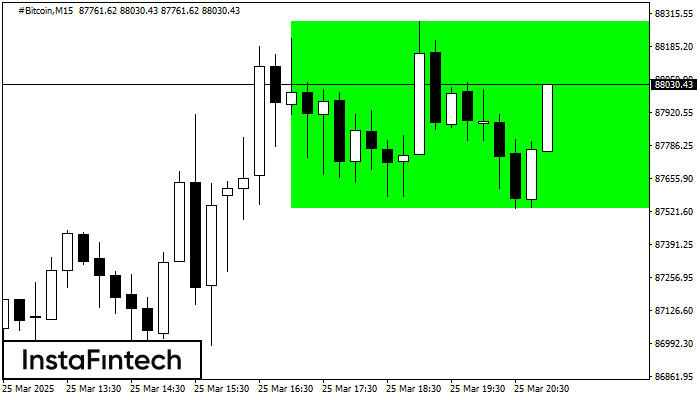
According to the chart of M15, #Bitcoin formed the Bullish Rectangle which is a pattern of a trend continuation. The pattern is contained within the following borders: the lower border 87534.22 – 87534.22 and upper border 88285.10 – 88285.10. In case the upper border is broken, the instrument is likely to follow the upward trend.
The M5 and M15 time frames may have more false entry points.
Xem thêm
- All
- Double Top
- Flag
- Head and Shoulders
- Pennant
- Rectangle
- Triangle
- Triple top
- All
- #AAPL
- #AMZN
- #Bitcoin
- #EBAY
- #FB
- #GOOG
- #INTC
- #KO
- #MA
- #MCD
- #MSFT
- #NTDOY
- #PEP
- #TSLA
- #TWTR
- AUDCAD
- AUDCHF
- AUDJPY
- AUDUSD
- EURCAD
- EURCHF
- EURGBP
- EURJPY
- EURNZD
- EURRUB
- EURUSD
- GBPAUD
- GBPCHF
- GBPJPY
- GBPUSD
- GOLD
- NZDCAD
- NZDCHF
- NZDJPY
- NZDUSD
- SILVER
- USDCAD
- USDCHF
- USDJPY
- USDRUB
- All
- M5
- M15
- M30
- H1
- D1
- All
- Buy
- Sale
- All
- 1
- 2
- 3
- 4
- 5
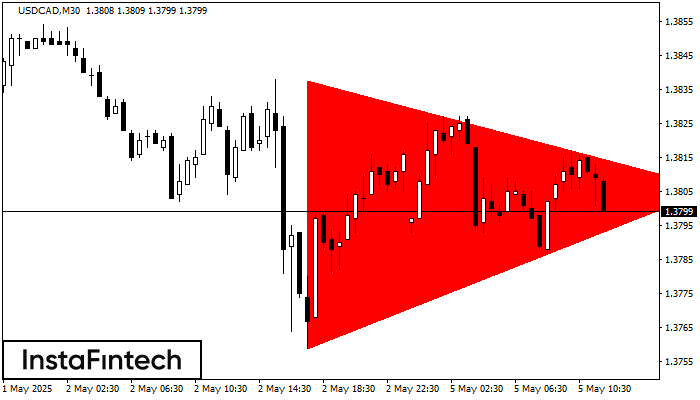
На графике USDCAD на M30 сформировалась фигура «Медвежий симметричный треугольник». Торговые рекомендации: Пробой нижней границы 1.3759 с большой долей вероятности приведет к продолжению нисходящего тренда
Открыть график инструмента в новом окне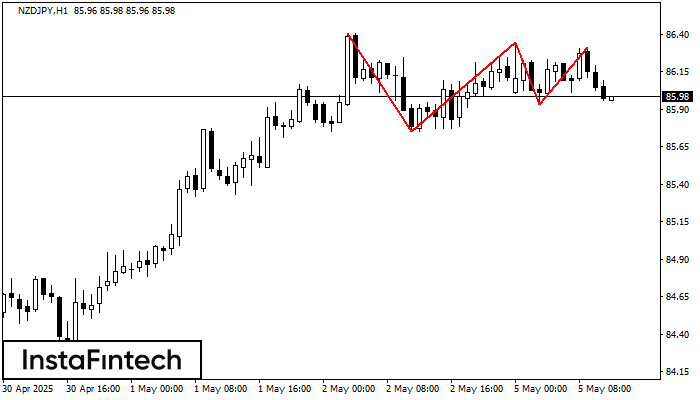
На графике NZDJPY H1 образовалась фигура «Тройная вершина», которая сигнализирует об изменении тенденции. Возможный сценарий: После формирования третьей вершины котировка постарается пробить нижнюю границу 85.93, где трейдеру и стоило
Открыть график инструмента в новом окне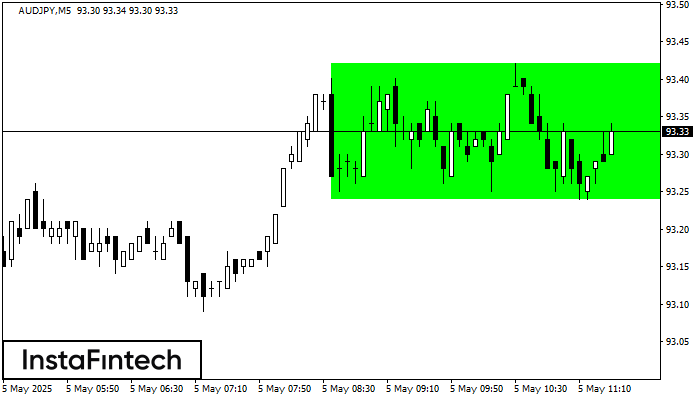
Сформирована фигура «Прямоугольник» на графике AUDJPY M5. Тип фигуры: Продолжение тренда; Границы: Верхняя 93.42, Нижняя 93.24; Сигнал: позицию на покупку следует открывать выше верхней границы прямоугольника 93.42
Таймфреймы М5 и М15 могут иметь больше ложных точек входа.
Открыть график инструмента в новом окне


