

signal strength 2 of 5

According to the chart of M15, NZDCAD formed the Bearish Symmetrical Triangle pattern. This pattern signals a further downward trend in case the lower border 0.8172 is breached. Here, a hypothetical profit will equal the width of the available pattern that is -37 pips.
The M5 and M15 time frames may have more false entry points.
Vea asimismo
- All
- Double Top
- Flag
- Head and Shoulders
- Pennant
- Rectangle
- Triangle
- Triple top
- All
- #AAPL
- #AMZN
- #Bitcoin
- #EBAY
- #FB
- #GOOG
- #INTC
- #KO
- #MA
- #MCD
- #MSFT
- #NTDOY
- #PEP
- #TSLA
- #TWTR
- AUDCAD
- AUDCHF
- AUDJPY
- AUDUSD
- EURCAD
- EURCHF
- EURGBP
- EURJPY
- EURNZD
- EURRUB
- EURUSD
- GBPAUD
- GBPCHF
- GBPJPY
- GBPUSD
- GOLD
- NZDCAD
- NZDCHF
- NZDJPY
- NZDUSD
- SILVER
- USDCAD
- USDCHF
- USDJPY
- USDRUB
- All
- M5
- M15
- M30
- H1
- D1
- All
- Buy
- Sale
- All
- 1
- 2
- 3
- 4
- 5
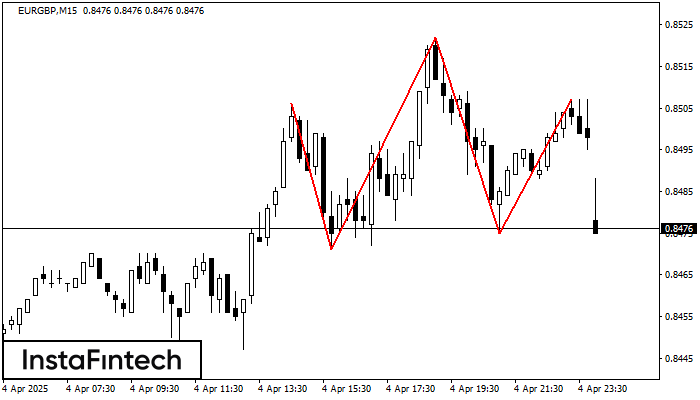
Según el gráfico de M15, EURGBP formó el patrón. El techo de la Cabeza está establecido en 0.8522 mientras la línea media del Cuello se encuentra en 0.8471/0.8475. La formación
Los marcos de tiempo M5 y M15 pueden tener más puntos de entrada falsos.
Open chart in a new window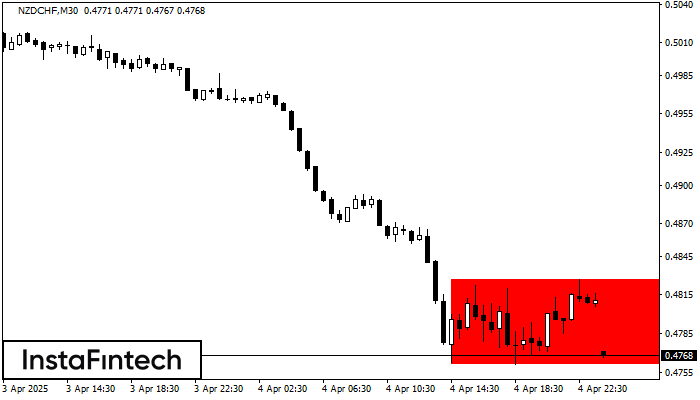
Según el gráfico de M30, NZDCHF formó el Rectángulo Bajista. El patrón indica la continuación de una tendencia. El límite superior es 0.4827, el límite inferior es 0.4761. La señal
Open chart in a new window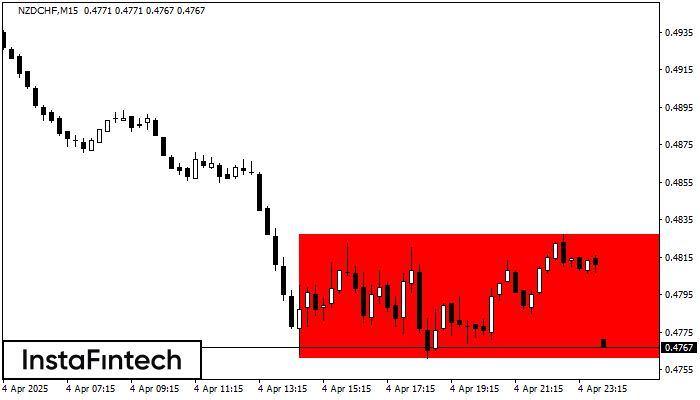
Según el gráfico de M15, NZDCHF formó el Rectángulo Bajista. El patrón indica la continuación de una tendencia. El límite superior es 0.4827, el límite inferior es 0.4761. La señal
Los marcos de tiempo M5 y M15 pueden tener más puntos de entrada falsos.
Open chart in a new window


