

Dolzarb patternlar
Паттерны – это графические модели, которые "рисует" цена на графике. Один из постулатов технического анализа говорит нам о том, что история (движение цены) всегда повторяется. Это значит, что в похожих ситуациях движение цены, зачастую, будет похожим, что позволяет с высокой долей вероятности спрогнозировать дальнейшее развитие ситуации.
Актуальные паттерны
- Все
- Вымпел
- Голова и плечи
- Двойная вершина
- Прямоугольник
- Треугольник
- Тройная вершина
- Флаг
- Все
- #AAPL
- #AMZN
- #Bitcoin
- #EBAY
- #FB
- #GOOG
- #INTC
- #KO
- #MA
- #MCD
- #MSFT
- #NTDOY
- #PEP
- #TSLA
- #TWTR
- AUDCAD
- AUDCHF
- AUDJPY
- AUDUSD
- EURCAD
- EURCHF
- EURGBP
- EURJPY
- EURNZD
- EURRUB
- EURUSD
- GBPAUD
- GBPCHF
- GBPJPY
- GBPUSD
- GOLD
- NZDCAD
- NZDCHF
- NZDJPY
- NZDUSD
- SILVER
- USDCAD
- USDCHF
- USDJPY
- USDRUB
- Все
- M5
- M15
- M30
- H1
- D1
- Все
- Покупка
- Продажа
- Все
- 1
- 2
- 3
- 4
- 5

On the chart of the NZDCAD M5 trading instrument, the Triple Top pattern that signals a trend change has formed. It is possible that after formation of the third peak
The M5 and M15 time frames may have more false entry points.
Открыть график инструмента в новом окне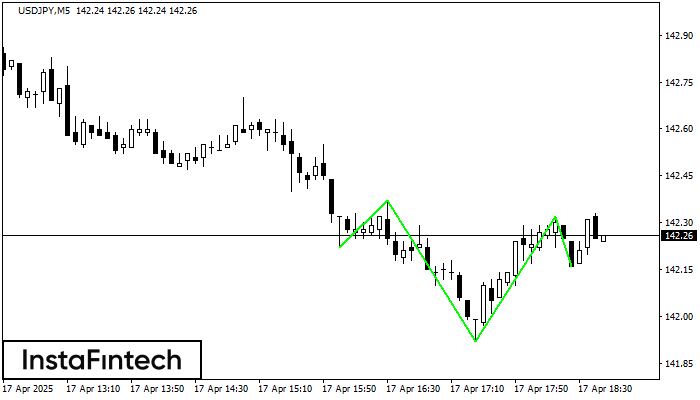
According to the chart of M5, USDJPY produced the pattern termed the Inverse Head and Shoulder. The Head is fixed at 141.92 while the median line of the Neck
The M5 and M15 time frames may have more false entry points.
Открыть график инструмента в новом окне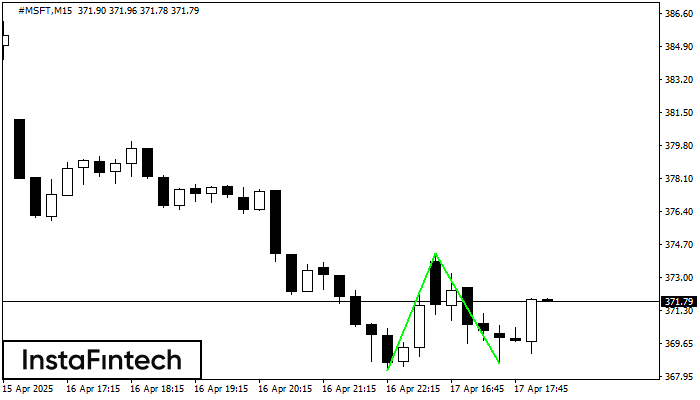
The Double Bottom pattern has been formed on #MSFT M15. This formation signals a reversal of the trend from downwards to upwards. The signal is that a buy trade should
The M5 and M15 time frames may have more false entry points.
Открыть график инструмента в новом окне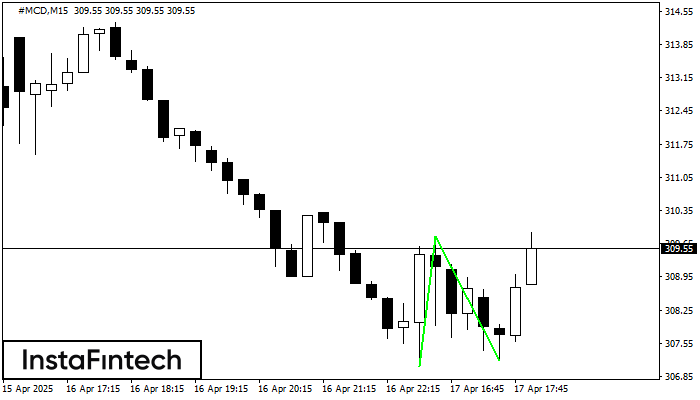
The Double Bottom pattern has been formed on #MCD M15. Characteristics: the support level 307.06; the resistance level 309.81; the width of the pattern 275 points. If the resistance level
The M5 and M15 time frames may have more false entry points.
Открыть график инструмента в новом окне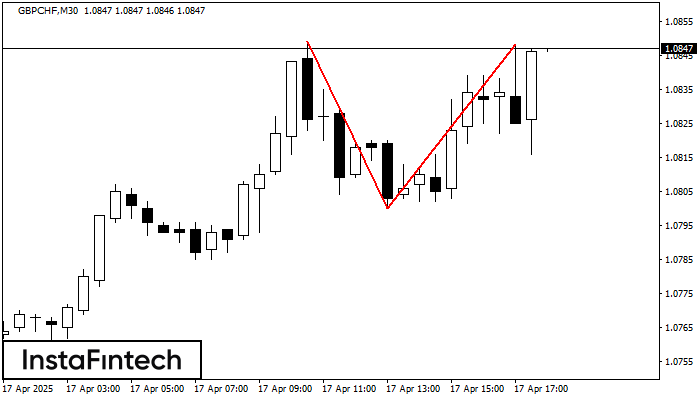
The Double Top pattern has been formed on GBPCHF M30. It signals that the trend has been changed from upwards to downwards. Probably, if the base of the pattern 1.0800
Открыть график инструмента в новом окне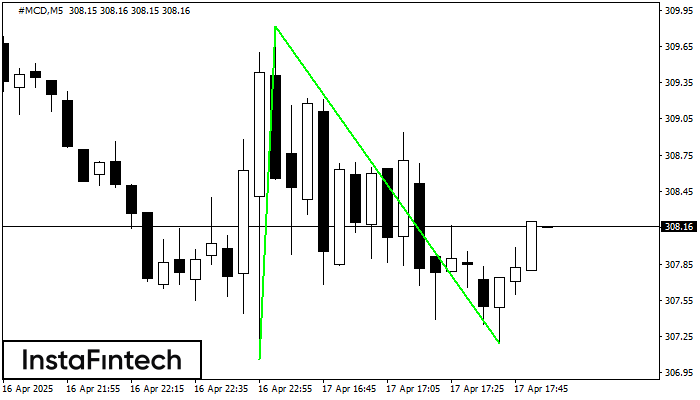
The Double Bottom pattern has been formed on #MCD M5. Characteristics: the support level 307.06; the resistance level 309.81; the width of the pattern 275 points. If the resistance level
The M5 and M15 time frames may have more false entry points.
Открыть график инструмента в новом окне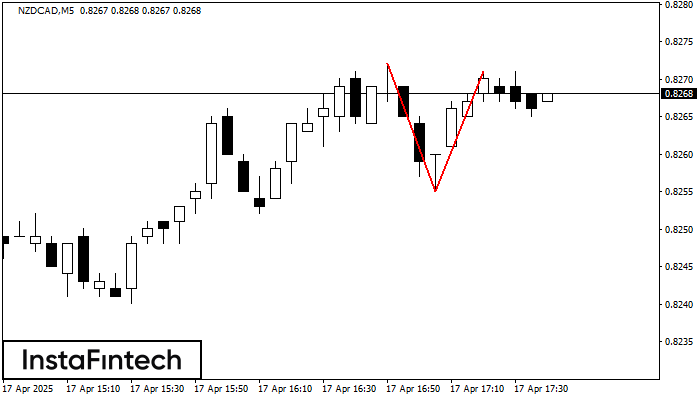
The Double Top pattern has been formed on NZDCAD M5. It signals that the trend has been changed from upwards to downwards. Probably, if the base of the pattern 0.8255
The M5 and M15 time frames may have more false entry points.
Открыть график инструмента в новом окне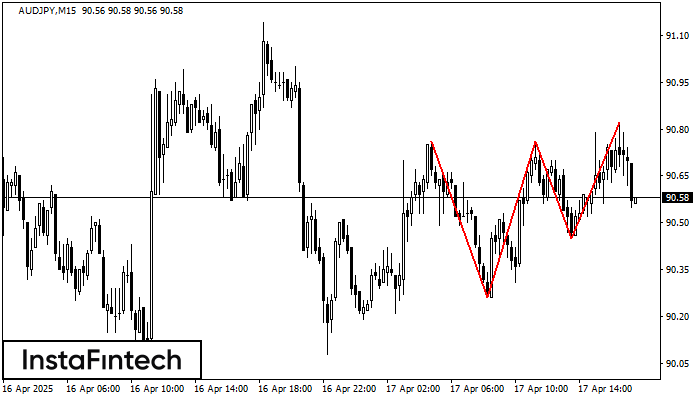
The Triple Top pattern has formed on the chart of the AUDJPY M15. Features of the pattern: borders have an ascending angle; the lower line of the pattern
The M5 and M15 time frames may have more false entry points.
Открыть график инструмента в новом окне
The Double Bottom pattern has been formed on #EBAY M15; the upper boundary is 67.35; the lower boundary is 65.16. The width of the pattern is 215 points. In case
The M5 and M15 time frames may have more false entry points.
Открыть график инструмента в новом окне


